Imagine two researchers working side by side at the same desk. The first one searches for answers by scanning text and matching words to your question. The second does exactly the same thing, but also maintains a large whiteboard behind them covered in arrows and connections: diseases linked to treatments, products linked to suppliers, incidents linked to root causes, engineers linked to the services they own. If you walk up and ask “what is the boiling point of water?”, the whiteboard does nothing useful. But if you ask “why did the service degrade after the config change three weeks ago, and which team needs to act?”, the researcher with the whiteboard gives you a dramatically better answer.
That is the essential intuition behind GraphRAG, and it is also the intuition that the research community has been struggling to evaluate rigorously. When Microsoft released From Local to Global: A Graph RAG Approach to Query-Focused Summarization in 2024, it triggered a wave of excitement. Suddenly, every RAG project was asking whether it should add a knowledge graph. Many teams did. And many of those teams were later quietly disappointed.
The problem was not that GraphRAG is bad. The problem was that the field lacked a clear, principled answer to a deceptively simple question: when does adding graph structure actually help, and when is it just overhead?
That is precisely the question that When to Use Graphs in RAG: A Comprehensive Analysis for Graph Retrieval-Augmented Generation, an ICLR 2026 paper, sets out to answer. It introduces GraphRAG-Bench, a benchmark specifically designed to stress-test GraphRAG systems across different task types and corpora. The findings are nuanced, practical, and occasionally surprising, and they are worth reading carefully before you commit to building a graph pipeline.
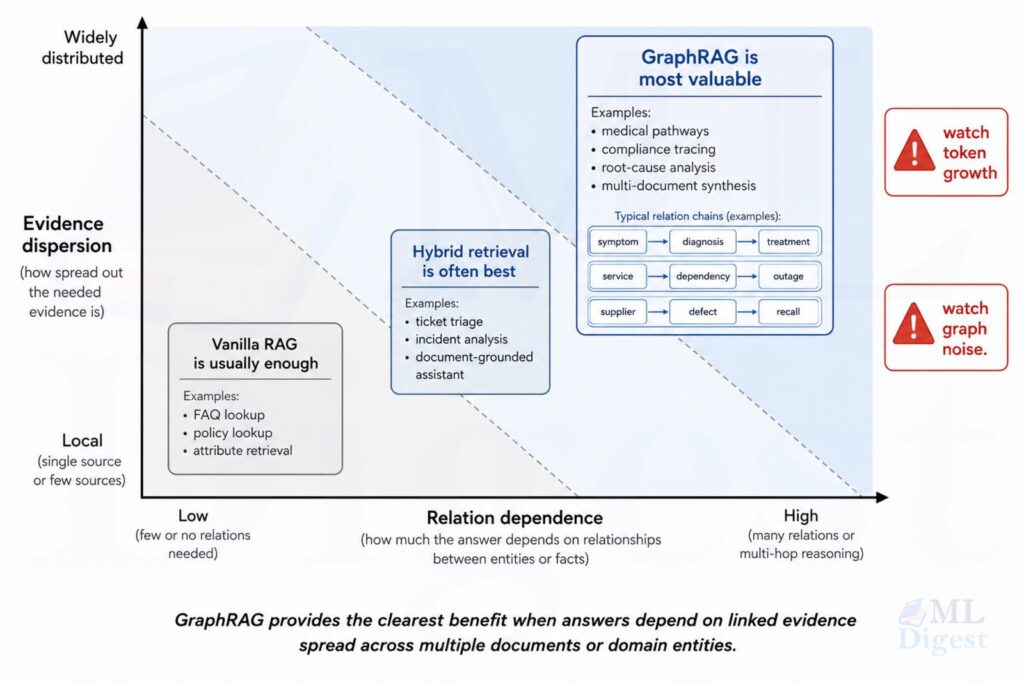
The paper’s headline conclusion is worth quoting directly: GraphRAG is not a universal upgrade over vanilla Retrieval-Augmented Generation (RAG). Graph structures provide measurable benefits specifically when the answer depends on relationships among entities, documents, or events, not merely on term matching. For simple fact lookup, especially when reranking and chunking are already well tuned, vanilla RAG remains very competitive. The value of GraphRAG rises with reasoning complexity, evidence dispersion, and domain hierarchy, but so do indexing cost, latency, and token usage.
This post walks through the paper’s key findings, adds context from engineering practice, and gives you a concrete framework for deciding whether your workload actually needs a graph.
1. What GraphRAG Does Differently
To understand when GraphRAG helps, you first need to understand what it adds over vanilla RAG.
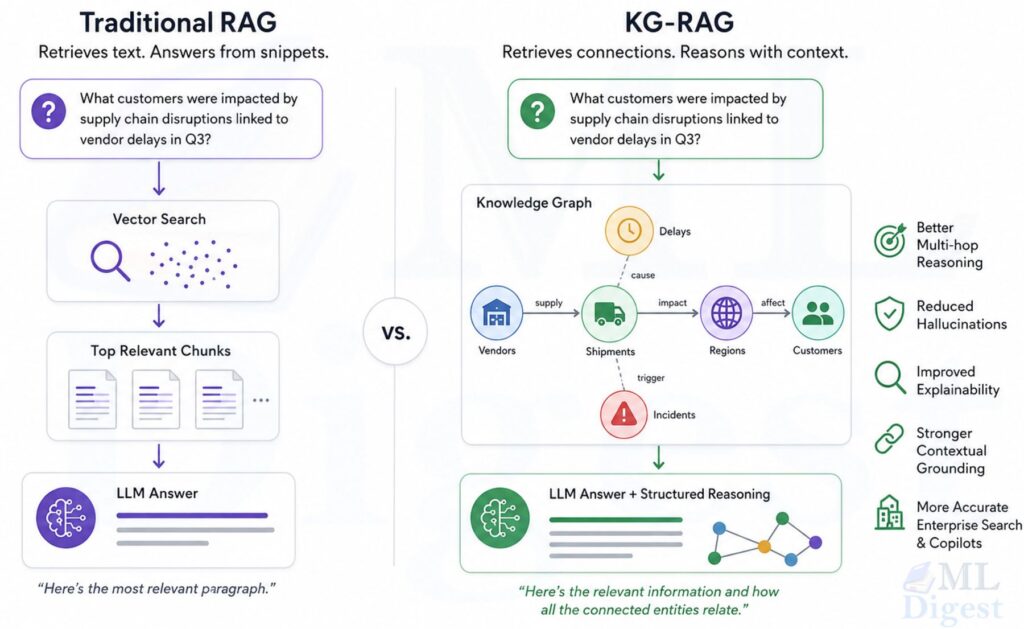
Vanilla RAG stores text chunks in a dense vector index. At query time, it embeds the question, retrieves the top-k most semantically similar chunks, and passes them to a language model. It works well when the answer is clearly stated in one or two passages. The design is elegant, fast, and easy to maintain.
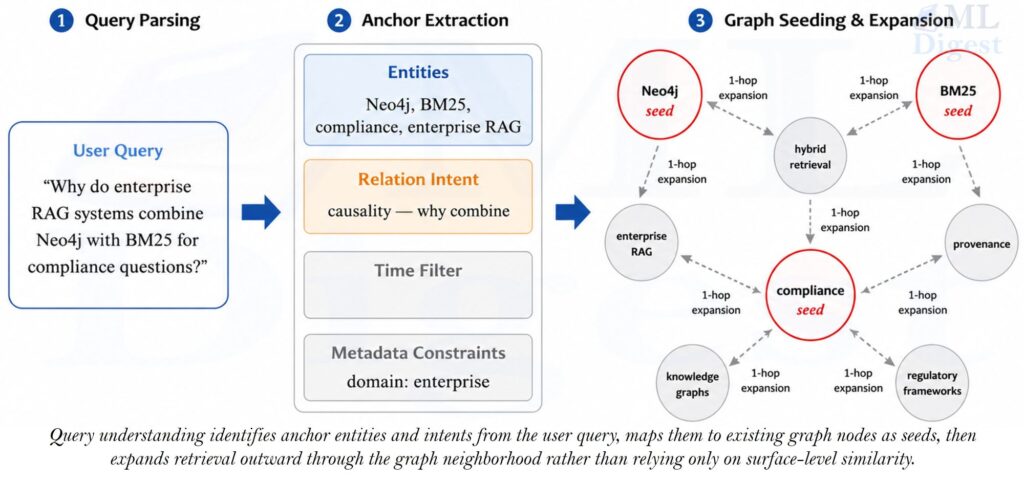
GraphRAG adds an explicit relational layer on top of that — an approach that builds on the foundations of knowledge graph-based RAG. During indexing, it extracts entities (people, places, concepts, events, services, drugs, policies) and the relationships between them, then stores those as a knowledge graph. At query time, it uses a seed retrieval step to find initial anchor nodes, then expands along graph edges to collect connected evidence. The language model then reasons over a structured neighborhood of related facts rather than a bag of similar passages.
The difference in retrieval behavior is meaningful:
%%{init: {'theme': 'base', 'themeVariables': {'primaryColor': '#f9f9f9', 'fontSize': '22px', 'edgeLabelBackground':'#f9f9f9'}}}%%

flowchart LR
    subgraph Query
        Q[User Query]
    end
    subgraph Vanilla RAG
        Q --> V[Vector Retrieval]
        V --> C1[Top-k Similar Chunks]
        C1 --> A1[LLM Answer<br>Vanilla RAG]
    end
    subgraph GraphRAG
        Q --> G[Seed Retrieval]
        G --> N[Graph Expansion<br>along edges]
        N --> C2[Connected Evidence Set]
        C2 --> A2[LLM Answer<br>GraphRAG]
    end
The key word in that diagram is “along edges.” Graph traversal can follow paths like:
- symptom to diagnosis to treatment protocol
- supplier to material change to component defect to product recall
- paper to cited method to benchmark to failure mode
- service to dependency to downstream incident to mitigation action
Vanilla RAG can find any one of those nodes if it appears in a relevant chunk. What it cannot reliably do is connect them in the right order, especially when each piece of evidence lives in a different part of the corpus and no single chunk contains the full chain.
This is the core value proposition of GraphRAG. It is not about retrieval accuracy in isolation. It is about retrieval coherence across linked pieces of evidence.
1.1 A mental model for estimating net value
The paper does not define a single formula for “GraphRAG benefit,” but from the empirical results you can build a useful engineering approximation:
$$
\begin{aligned}
\text{Net Value of GraphRAG}
&\approx
\text{Relational Recall Gain}\\
&+ \text{Reasoning Coherence Gain} \\
&- \text{Graph Construction Noise} \\
&- \text{Token and Latency Cost}
\end{aligned}
$$
If the first two terms are small because your workload is mostly local fact lookup, GraphRAG will disappoint. If they are large and your graph is clean and well-structured, the extra work can be genuinely worth it. The practical challenge is that most teams underestimate the noise term and overestimate the coherence gain before they have data.
2. The Benchmark Problem GraphRAG-Bench Solves
One reason the research community struggled to answer the “when does GraphRAG help?” question is that existing benchmarks were not designed to expose the difference. The GraphRAG-Bench paper identifies three specific weaknesses in prior evaluations.
First, questions labeled “multi-hop” in older benchmarks are often just sequential fact lookups. The model needs to retrieve fact A and then fact B, but neither requires understanding the structural relationship between them. A well-tuned dense retriever can answer many of these without any graph at all.
Second, many benchmark corpora are too flat or too generic. They do not contain the kind of dense, meaningful entity relationships that would reward graph traversal. Testing GraphRAG on a corpus with little inherent structure tells you almost nothing about whether it would help on a corpus with rich structure.
Third, and perhaps most importantly, most evaluations only judge the final answer. They do not separately measure graph construction quality, retrieval quality, or token efficiency. That means you can have a system where the graph is noisy, the retrieval is bloated, and the final answer is slightly better because the language model happens to be powerful enough to recover, and the evaluation will record that as a win for GraphRAG. That is not informative.
GraphRAG-Bench addresses all three problems. It evaluates four distinct task levels:
- Fact retrieval (Level 1): single-fact or direct lookup questions
- Complex reasoning (Level 2): questions requiring connected inference
- Contextual summarization (Level 3): synthesis across multiple sources
- Creative generation (Level 4): open-ended generation grounded in corpus facts
It also uses two very different corpora deliberately. One is a collection of medical guidelines with strong domain hierarchy, explicit protocols, and clear entity relationships. The other is a set of pre-20th-century novels with loose, implicit narrative structure and much weaker inherent graph topology. That contrast is analytically important. A system that claims to benefit from graphs should benefit more on the medical corpus, where the underlying structure is genuinely richer.
2.1 Graph quality has its own metrics
One of the more engineering-useful contributions of the paper is that it measures graph quality separately from answer quality. Two properties matter most.
The first is connectivity: how many relationships does the average entity in your graph have? A densely connected graph gives traversal more paths to follow, increasing the chance that a reasoning path linking two distant facts actually exists in the graph.
Average degree measures how connected the graph is. A higher average degree means more entities have more relationships, which gives traversal more paths to follow:
$$
\text{AverageDegree} = \frac{1}{|V|} \sum_{v \in V} \deg(v)
$$
The second is coherence: do the neighborhoods around each entity form tight, meaningful clusters, or are they just a loose collection of loosely related terms? A coherent neighborhood is a sign that the edges represent real domain relationships rather than coincidental co-occurrence in text.
Average clustering coefficient measures whether connected neighborhoods are internally coherent. A high clustering coefficient means that when entity A connects to B and C, B and C are often also connected to each other, which is a sign that the local neighborhood represents a real concept cluster rather than a loose bag of linked terms:
$$
\text{AverageClusteringCoefficient} = \frac{1}{|V|} \sum_{v \in V} C(v),\ \quad C(v) = \frac{2T(v)}{\deg(v)(\deg(v)-1)}
$$
where $T(v)$ is the number of triangles through node $v$.
The paper finds that denser, more coherent graphs consistently lead to better retrieval and answer quality downstream. The practical implication is that graph construction quality is not a given. It needs to be checked before you draw any conclusions about whether GraphRAG helps on your data.
2.2 Retrieval difficulty and reasoning complexity are not the same thing
One conceptual contribution of the paper that I think is underappreciated is the separation of retrieval difficulty from reasoning complexity. These two properties are often conflated in RAG discussions, but they are genuinely different.
Retrieval difficulty asks: can the system find the right evidence? Reasoning complexity asks: can the system combine that evidence into the right explanation? A question can have low retrieval difficulty (the right passage is easy to find) but high reasoning complexity (combining three passages in the right order is hard). The reverse is also possible.
GraphRAG can help in both scenarios, but for different reasons. In the first scenario, it helps by giving the model cleaner structure to reason with. In the second, it helps by surfacing evidence that semantic similarity alone would miss. Conflating these two effects makes it hard to debug a GraphRAG system when it underperforms. The benchmark makes both dimensions visible, which is the right engineering instinct.
3. What the Results Actually Show
The paper’s empirical findings are the part worth reading carefully, because they push back against some common assumptions in both directions.
3.1 Simple fact retrieval: vanilla RAG holds its own
For simple fact retrieval, the paper finds that well-tuned vanilla RAG is competitive with graph-based approaches. The best graph systems land in a similar range rather than dramatically ahead. The mechanism is exactly what you would expect: when the needed evidence is contained in one or two locally coherent passages, graph expansion does not add recall. It can actually hurt precision by pulling in logically adjacent but contextually unnecessary content.
This result is a useful corrective for a tendency I have observed in practice. Teams sometimes reach for GraphRAG as a first-line solution because it feels more sophisticated. But if the actual workload is mostly FAQ lookup, policy question answering, attribute retrieval, or short customer-support responses anchored in a single chunk, the right investment is chunking strategy, a good reranker, and context compression, not a knowledge graph.
3.2 Complex reasoning: where graphs start to earn their keep
The picture changes clearly on complex reasoning tasks. Graph methods show a meaningful and consistent lead over well-tuned vanilla RAG, and that lead is even more pronounced on the structured medical corpus.
The intuition is direct. Complex reasoning questions do not ask for several isolated facts. They ask for the connections between those facts. “What sequence of events led from this policy change to this outcome?” is not a retrieval question in the usual sense. It is a graph traversal question. Vector similarity finds content that looks like the query. Graph traversal finds content that is structurally related to the query’s answer path.
This distinction matters for query classification in production systems. A small classifier that distinguishes relational from non-relational queries can route appropriately, using vector retrieval for one type and graph expansion for the other, without paying the full cost of graph traversal on every request.
3.3 Contextual summarization: a clear advantage
The paper shows the clearest and most consistent advantages for contextual summarization tasks. These require gathering fragments from across the corpus, organizing them, and producing a coherent explanation rather than a short answer. This is the task type that matches the original motivation for Microsoft’s GraphRAG work.
It is also worth noting that many enterprise questions are synthesis tasks in disguise. “Why did this launch fail in region X?” is not a retrieval question. It is a request to trace causality across a set of linked events. “How do these medical recommendations apply given this patient’s history and contraindications?” requires connecting protocol documents, history records, and drug interaction data. “What changed across the last three design reviews that led to the current architecture decision?” requires understanding temporal structure in a document set.
For these questions, graph structure acts as a scaffolding that helps the model avoid both missing a key dependency and losing the logical thread that connects pieces of evidence.
3.4 Creative generation: faithfulness improves, but focus can suffer
For creative generation tasks, the results show an interesting trade-off. Both HippoRAG and RAPTOR, a tree-organized retrieval approach, substantially improve faithfulness scores over vanilla RAG. So graph structures do improve factual grounding in generative tasks.
However, broader evidence coverage does not always improve in parallel with faithfulness. Some GraphRAG configurations retrieve more relevant information overall while also introducing redundancy. The model receives a richer but noisier context, and the tradeoff between faithfulness and focus shifts.
The practical takeaway: for tasks where you want generation that is tightly grounded in specific connected evidence, graph structure helps. For tasks where you want broad, efficiently-generated responses, the overhead may not be worth it.
3.5 The token cost problem is not optional
The paper’s cost analysis is blunt, and it deserves its own emphasis.
Vanilla RAG is lean by design: it retrieves a small number of relevant passages and passes them to the model. Graph-based systems can stay similarly compact, but many do not. Aggressive graph traversal and community summarization pipelines can expand the context sent to the language model by an order of magnitude or more — increasing inference costs and KV cache memory demands proportionally — and some global graph approaches push that into the hundreds of thousands of tokens per query.
A system can be theoretically correct and practically untenable at the same time. If your latency budget is tight, if your context window is limited, or if your cost ceiling matters, that token growth can erase the accuracy advantage even when it is real.
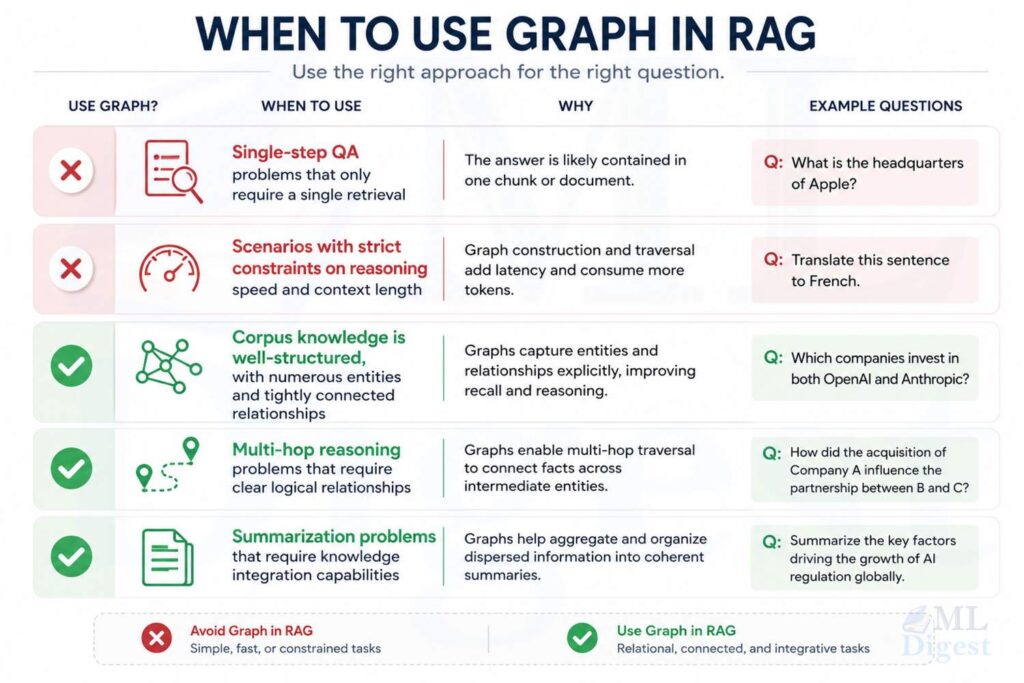
4. When Graph Structures Provide Measurable Benefits
Based on the benchmark results and engineering practice, graph structures reliably help when three conditions hold simultaneously:
- The answer requires relational reasoning across multiple entities, not isolated lookup.
- The corpus contains stable entities or concepts with meaningful, structured edges.
- The question requires evidence synthesis across distance, hierarchy, or time.
4.1 Domains with explicit ontologies or protocols
The most natural GraphRAG candidates are domains where the structure already exists in the underlying knowledge system. Medical guidelines connect diseases, symptoms, diagnostic tests, and treatment protocols in sequences that are explicitly defined. Compliance documentation connects regulations, clauses, obligations, and audit controls. Supply chain systems connect products, components, suppliers, defects, and recalls. Software dependency graphs connect services, dependencies, failures, and mitigation actions.
In all of these cases, the graph is not invented during indexing. It is recovered. The entity extractor and relation extractor are reading a structure that the domain professionals built over years of work. That is why GraphRAG tends to work well in these settings: the signal-to-noise ratio of extracted edges is high because the underlying structure is explicit and stable.
This is also why GraphRAG tends to struggle on flat, unstructured corpora like general news archives or heterogeneous enterprise chat histories. When the relation extraction step has to infer structure from loosely organized text, the resulting graph is often too noisy to reward traversal.
4.2 Questions that ask “why” or “how”, not just “what”
There is a simple heuristic from the paper that I find practically useful. Questions that start with “what” tend to be retrieval questions, answered well by vector search. Questions that start with “why,” “how,” or “which sequence” tend to be graph questions, because their answers are paths rather than passages.
Some examples from real enterprise contexts:
- “Why did revenue drop after the policy change in region X?” requires connecting the policy change to the affected business logic, the affected customers, and the resulting financial impact.
- “How did this patient end up on this treatment path given their initial presentation?” requires following a clinical decision chain.
- “Which design decisions caused the incident to propagate beyond the initial failure?” requires tracing a dependency graph through multiple hops.
For all of these, the answer is not in any single passage. It is in the structure connecting several passages.
4.3 Long-horizon enterprise memory
One of the most compelling GraphRAG use cases in practice, and one that the paper’s medical-corpus results support, is persistent organizational memory. This challenge overlaps with the broader problem of memory in agentic systems, where persistent, structured recall is essential for multi-step reasoning across long time horizons. Enterprise systems accumulate tickets, chats, design documents, incident reports, code, and ownership metadata. The problem is that any given query may require connecting artifacts that live in different systems, were created at different times, and are linked by organizational relationships rather than textual similarity.
Graph edges can represent those persistent organizational connections: “this ticket references that incident,” “this decision document supersedes that policy,” “this service is owned by this team, which was also responsible for that previous outage.” Vector search can find similar text. A graph can represent persistent institutional structure.
4.4 Multi-document summarization with causal or temporal dependencies
One last scenario where graph structure proves its value is multi-document summarization when the summary must preserve dependencies or chronological order. The graph acts as a scaffold that helps the model maintain the correct logical sequence instead of producing a summary that is locally accurate but globally inconsistent.
This is different from generic summarization where the goal is just coverage. Dependency-preserving summarization is a harder task, and the paper’s Level 3 results show that graph methods have a clear advantage there.
5. When Vanilla RAG Is the Better Choice
The paper is equally clear about the cases where GraphRAG is unnecessary or counterproductive, and these deserve equal weight.
5.1 Direct lookup workloads
If the vast majority of queries are answered by matching a single chunk or table row, GraphRAG adds overhead without adding value. Product specification lookups, exact policy clause retrieval, glossary queries, and profile attribute questions all fall into this category. For these, a well-tuned retriever with a good reranker is both simpler and more precise.
5.2 Noisy or unreliable relation extraction
GraphRAG is only as good as its graph, and graph quality depends entirely on the quality of entity extraction and relation extraction. If the extracted entities are ambiguous, if linking is inconsistent, or if the relations are hallucinated or overly generic, the graph becomes a structured mechanism for spreading noise. A bad graph is worse than no graph because it adds confident-looking but misleading structure to the retrieval context.
This is the most common source of quiet failure in real GraphRAG projects. The pipeline runs, produces a graph, and the system looks like it is working. But the edges do not reflect the reasoning structure the users actually care about, and the answers are quietly worse or less precise than they would be with well-tuned vanilla RAG.
5.3 Fast-changing corpora with little stable structure
If the corpus changes continuously and there is little persistent structure to amortize indexing cost, graph maintenance can easily become more expensive than the benefit justifies. Customer support ticket streams, live news feeds, and rapidly evolving product documentation often fall into this category. Graph refresh is slow, and a stale graph is not much better than no graph.
5.4 Tight latency and token budgets
If you are building an interactive product where users expect fast responses, the token cost gap described in section 3.5 is not academic. Even a moderate graph expansion can add hundreds of milliseconds of latency and double or triple inference costs. In those settings, reranked RAG plus context compression often delivers a better product outcome even when GraphRAG would theoretically be more accurate.
6. Why GraphRAG Projects Fail in Practice
Even when a task looks graph-friendly, implementation mistakes can erase the theoretical benefit. After reading through the benchmark analysis and thinking about how these systems fail in practice, four failure modes stand out clearly.
6.1 Strong nodes, weak edges
Entity extraction is generally much easier than relation extraction. A pipeline can correctly identify products, services, drugs, incidents, and owners while still producing edges that are too generic or too noisy to be useful. “Entity A is mentioned near Entity B in a document” is a very different thing from “Entity A caused Entity B through the following mechanism.”
The result is a graph that looks dense and connected but does not represent the causal or hierarchical structure that makes traversal meaningful. Graph traversal on such a graph amplifies loose associations rather than true reasoning paths.
The fix is to define relation types explicitly before extraction and to evaluate edge quality separately from node quality. If you cannot articulate what your edges mean, the graph will not help with reasoning.
6.2 Expansion that is too aggressive
Many GraphRAG systems introduce a hyperparameter controlling how many hops to traverse from seed nodes, and many teams set that parameter too high. The intuition is that more context is better. The empirical result is that broader graphs often hurt precision. Each additional hop introduces nodes that are structurally related to the answer but not semantically relevant to the specific query.
The paper’s token-cost analysis shows this pattern clearly. Larger connected context is not the same as better context. The right amount of graph expansion is the smallest amount that includes the necessary evidence path, not the largest amount that is computationally feasible.
6.3 Graphs that do not age well
Graph construction is an upfront investment that pays off only if the graph remains accurate over time. In practice, ownership changes, services are renamed, policies are revised, and organizational relationships shift. If graph refresh is slow, inconsistent, or manual, the system ends up paying the retrieval cost of graph traversal while delivering the accuracy of a stale graph. That is the worst of both worlds.
For high-churn corpora, lightweight hybrid retrieval with occasional graph lookups for specific relation types is usually safer than a comprehensive graph pipeline.
6.4 Evaluating only final answer quality
This is the most pervasive mistake, and it is easy to understand why it happens. Final answer accuracy is the most visible metric and the easiest to explain to stakeholders, but evaluating a full GraphRAG pipeline requires going beyond standard LLM performance metrics. It hides whether the graph is genuinely helping retrieval, merely inflating prompt size, or allowing the language model to compensate for weak chunking elsewhere in the stack.
For a serious pilot, you need to measure at least four things separately: graph construction quality (how well-connected and coherent the graph is, and whether a sample of edges make domain sense), retrieval quality (are the right pieces of evidence being surfaced?), answer quality (is the output faithful and accurate?), and operational cost (latency and token usage per query). If you only measure the final answer, you cannot tell whether GraphRAG is the source of the gain or whether a simpler system with better chunking and reranking would have achieved the same result more cheaply.
7. A Practical Decision Framework
Based on the benchmark findings, you can build a simple scorecard to evaluate whether your workload is likely to benefit from GraphRAG. Rate each criterion from 0 to 2.
| Criterion | 0 | 1 | 2 |
|---|---|---|---|
| Relation dependence | answer is contained in a single local passage | some cross-chunk linkage required | answer is primarily a path or dependency chain |
| Evidence dispersion | one passage | a few nearby passages | many distant passages or sources |
| Ontology strength | flat unstructured text | partial metadata or weak entities | explicit entities, typed relations, or domain workflows |
| Query type | direct lookup | light synthesis | explanation, diagnosis, causal tracing, or audit |
| Budget and latency fit | graph indexing cost is prohibitive | maybe affordable with selective expansion | indexing is amortized and token cost is acceptable |
Score interpretation:
- 0 to 3: start with vanilla RAG and invest in chunking, reranking, and context compression
- 4 to 6: consider hybrid retrieval, that is, vector retrieval plus selective graph expansion for specific query types
- 7 to 10: GraphRAG is worth a serious prototype, but validate graph quality first

8. Best Practices If You Decide to Build with GraphRAG
If your scorecard points toward GraphRAG, here are the practices the benchmark results support.
Start with a strong vanilla RAG baseline. This sounds obvious but is frequently skipped. Before concluding that your workload needs a graph, verify that you have a well-tuned retriever with reranking, good chunking, and context compression. A surprising number of “GraphRAG wins” in practice turn out to be wins over a weak baseline, not over a well-engineered dense retrieval system.
Define your relation types before extraction. Do not run a generic entity and relation extraction pipeline and hope the graph is useful. Decide first what edges mean in your domain. In a medical system, “contraindicates,” “first-line treatment for,” and “diagnostic criterion of” are meaningful relation types. “is related to” is not.
Measure graph quality independently. Before running any end-to-end evaluation, check how well-connected the graph is and manually inspect a sample of edges. If the graph is sparse or the edges are semantically vague, fix the construction pipeline first.
Control expansion depth aggressively. Start with one-hop expansion from seed nodes and measure retrieval precision. Add additional hops only if the one-hop context is demonstrably insufficient. The default instinct to expand broadly is usually wrong.
Audit edge quality on a sample before scaling. Pick fifty random edges and ask whether a domain expert would agree they represent a real relationship of the type your pipeline claims. If fewer than eighty percent pass that check, the graph is not ready.
Consider hybrid systems as the default. In practice, vector retrieval for the majority of queries plus targeted graph expansion for identified relational queries is often a better starting point than a heavy global graph pipeline. It amortizes the graph maintenance cost over the subset of queries that actually need it.
Summary
The GraphRAG-Bench paper gives the field something it has genuinely needed: a rigorous, multi-dimensional framework for evaluating when graph structures in RAG systems actually help. The findings push back against both the naive adoption of GraphRAG as a universal upgrade and the dismissal of it as mere complexity theater.
The clearest takeaway is that graph structure is a tool with a specific domain of effectiveness. That domain is workloads where the answer depends on linking dispersed evidence through typed relationships: medical pathways, compliance tracing, root-cause analysis, causal summarization, and long-horizon organizational memory. Outside that domain, especially for direct lookup, graph construction adds cost and noise without a corresponding accuracy benefit.
The sharper question to ask before any GraphRAG project is not “Is GraphRAG better than vanilla RAG?” It is: does this specific workload depend on relationship-aware retrieval strongly enough to justify graph construction, graph maintenance, and the additional token cost? If the answer is yes, prototype GraphRAG against a strong baseline and measure graph quality, retrieval quality, faithfulness, and cost separately. If the answer is no, invest in the retrieval fundamentals first and revisit after you have a strong baseline.

Happy is a seasoned ML professional with over 15 years of experience. His expertise spans various domains, including Computer Vision, Natural Language Processing (NLP), and Time Series analysis. He holds a PhD in Machine Learning from IIT Kharagpur and has furthered his research with postdoctoral experience at INRIA-Sophia Antipolis, France. Happy has a proven track record of delivering impactful ML solutions to clients.

Silpa brings 5 years of experience in working on diverse ML projects, specializing in designing end-to-end ML systems tailored for real-time applications. Her background in statistics (Bachelor of Technology) provides a strong foundation for her work in the field. Silpa is also the driving force behind the development of the content you find on this site.
Subscribe to our newsletter!