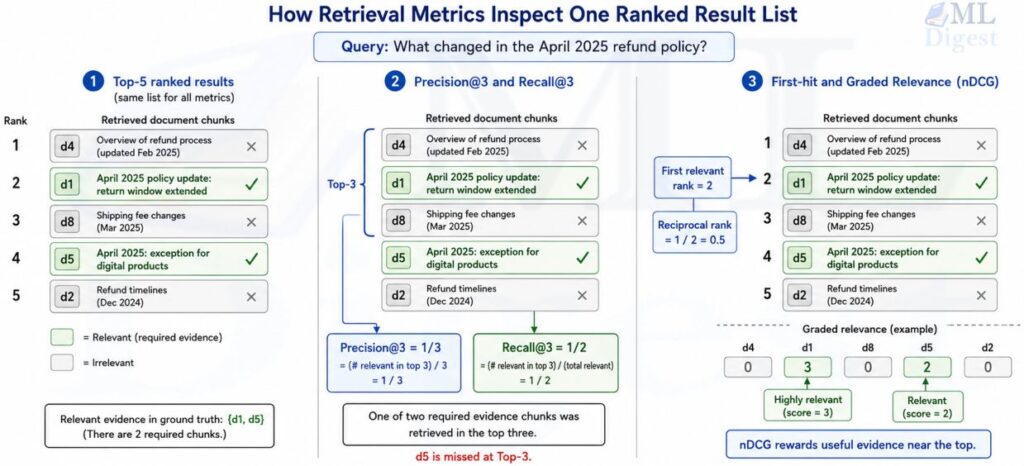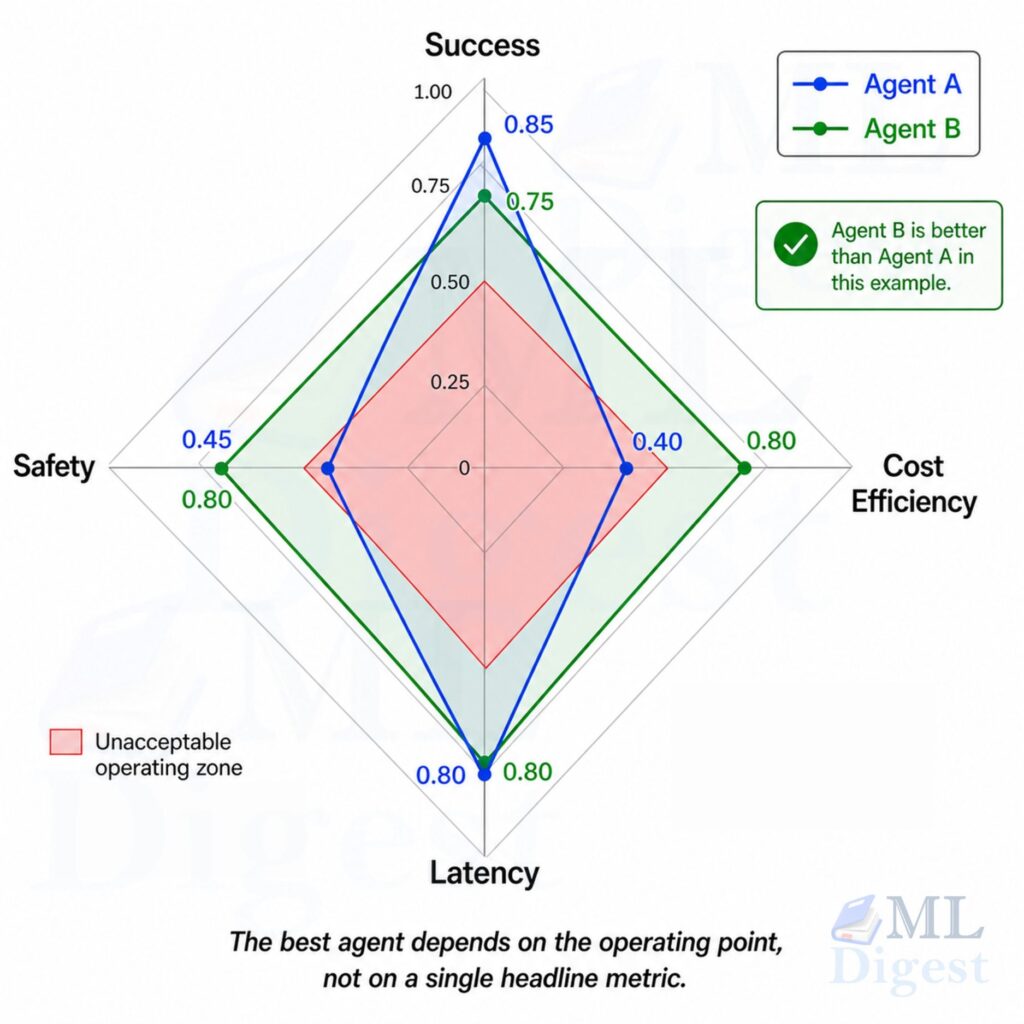
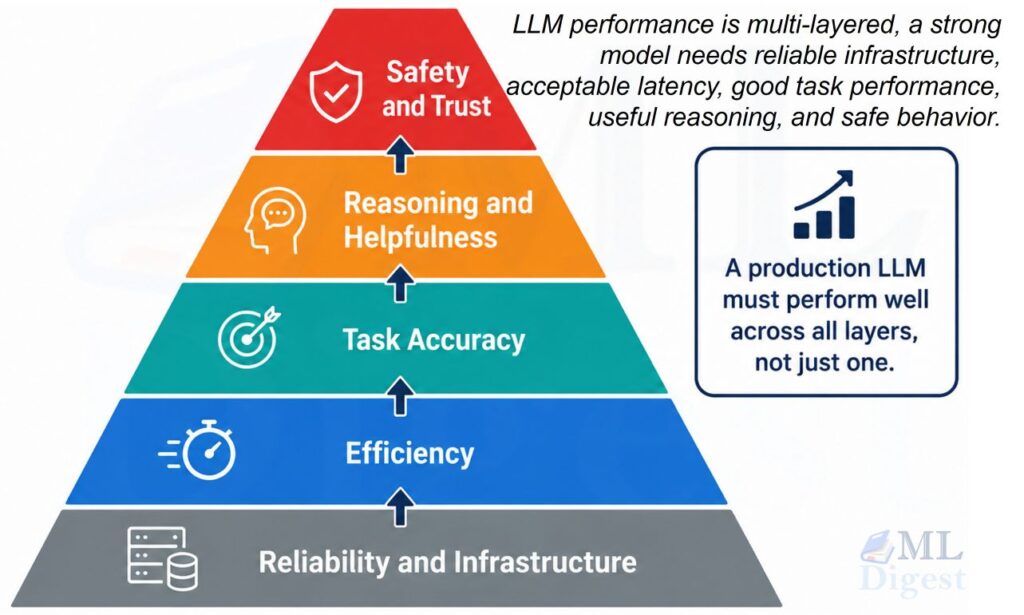
Evaluating a large language model is a bit like hiring a very articulate analyst. A polished answer can still be wrong, an accurate answer can still be too slow, and a safe answer can still be unhelpful. That is why LLM evaluation cannot rely on a single score. You need a portfolio of measurements that check quality, reasoning, safety, reliability, and efficiency from different angles.
This article gives a practical overview of how to measure LLM performance, why each metric exists, where it breaks down, and how to combine automated checks with human review. The goal is not just to name benchmarks, but to help you build an evaluation process you can actually trust.
1. Why LLM Evaluation Is Different
Traditional machine learning tasks often have a clean target label. A spam classifier predicts spam or not spam. An image classifier picks one class from a fixed set. In contrast, an LLM can produce many valid outputs for the same prompt.
For example, if you ask an LLM to summarize a research paper, two answers can differ in wording, sentence order, and level of detail while both being good. This means that exact string matching is often too strict. At the same time, a fluent answer can hide factual mistakes, unsupported claims, or subtle failures to follow instructions.
So, when you measure LLM performance, you are usually asking several questions at once:
- Is the answer correct?
- Is it relevant to the prompt?
- Does it follow the requested format or constraints?
- Is it safe and unbiased enough for the use case?
- Is it fast and cheap enough to deploy?
That is the core challenge. LLM evaluation is not only about language quality. It is about behavior under realistic conditions.
2. What Exactly Are You Evaluating?
Before picking metrics, define the evaluation object clearly. In practice, you are not evaluating only the base model. You are evaluating the full system:
$$
\text{LLM System} = \text{Model} + \text{Prompting} + \text{Decoding} \\
+ \text{Tools} + \text{Post-processing}
$$
This matters because small changes in temperature, output schema, retrieval context, or tool-calling logic can shift performance dramatically. If your application depends on structured outputs, controlling the output of an LLM becomes part of the evaluation setup rather than a separate concern.
At minimum, define these five pieces:
- The task, such as summarization, question answering, coding, classification, or tool use.
- The success criteria, such as correctness, groundedness, brevity, or JSON validity.
- The dataset, including a development split and a held-out test split.
- The generation protocol, including prompt template, temperature, max tokens, and sampling rules.
- The aggregation rule, such as average score, pass rate, or worst-case failure rate.
If these are not fixed, comparisons between models can be misleading.
3. Core Quantitative Metrics
Quantitative metrics are useful because they scale. They let you score hundreds or thousands of examples quickly. But each metric sees only part of the picture. Here are the most common ones, along with their strengths and weaknesses.
3.1 Perplexity
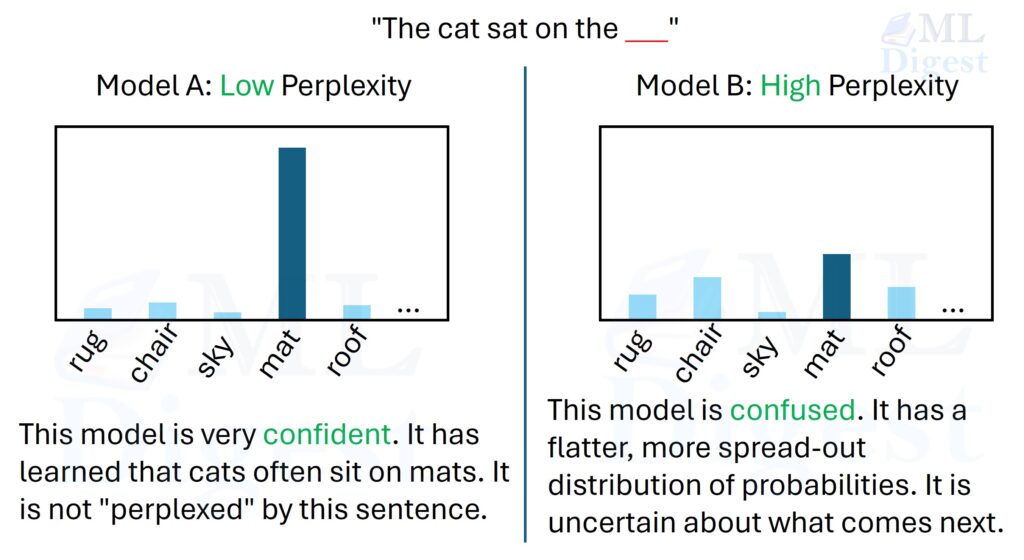
Perplexity measures how surprised a language model is by a sequence of tokens. If the model assigns high probability to the correct next token, perplexity goes down.
For a token sequence $x_1, x_2, \dots, x_N$, perplexity is:
$$
\mathrm{PPL} = \exp\left(-\frac{1}{N} \sum_{t=1}^{N} \log p(x_t \mid x_{<t})\right)
$$
Intuitively, lower perplexity means the model is better at predicting text from the same distribution.
Why it matters:
- It is useful during pretraining or language-model comparison.
- It gives a quick signal about next-token prediction quality.
Why it is not enough:
- A low-perplexity model can still be poor at instruction following.
- It does not directly measure factuality, safety, or reasoning quality.
- It depends on tokenization and evaluation corpus choice.
Perplexity is best viewed as an intrinsic modeling metric, not a full product metric.
3.2 Accuracy, Exact Match, Precision, Recall, and F1
For tasks with clear targets, classic supervised metrics are still very useful.
Accuracy is:
$$
\mathrm{Accuracy} = \frac{1}{n} \sum_{i=1}^{n} \mathbf{1}[\hat{y}_i = y_i]
$$
It works well for closed-form tasks such as classification.
Exact Match is even stricter. It checks whether the predicted answer matches the reference answer exactly after normalization.
Precision, Recall, and F1 score are useful when partial correctness matters:
$$
\mathrm{Precision} = \frac{TP}{TP + FP}
$$
$$
\mathrm{Recall} = \frac{TP}{TP + FN}
$$
$$
F_1 = \frac{2 \cdot \mathrm{Precision} \cdot \mathrm{Recall}}{\mathrm{Precision} + \mathrm{Recall}}
$$
These metrics are common in question answering, extraction, routing, moderation, and classification tasks.
Practical guidance:
- Use accuracy when there is one clear label.
- Use exact match when output formatting matters exactly.
- Use F1 when partial overlap still has value.
3.3 BLEU, ROUGE, and Related Overlap Metrics
BLEU and ROUGE compare generated text with reference text by measuring n-gram overlap.
- BLEU emphasizes precision, so it asks, “How much of the generated text matches the reference?”
- ROUGE emphasizes recall, so it asks, “How much of the reference content appears in the generated text?”
These metrics became standard in translation and summarization. They are still useful for rough trend tracking, but they have limitations for modern LLMs.
Main caveats:
- They penalize valid paraphrases.
- They do not reliably detect factual errors.
- They can reward superficial overlap rather than true meaning.
For that reason, teams often pair them with semantic metrics or human review.
3.4 Semantic Similarity Metrics
Modern evaluation often uses embedding-based metrics such as BERTScore, BLEURT, and COMET.
These methods compare meaning more than surface wording. If two answers say nearly the same thing in different words, a semantic metric is more likely to score them similarly.
This makes them more aligned with open-ended LLM tasks, but they still have limits:
- They may miss factual contradictions.
- They can inherit biases from the model used to score.
- They are often harder to interpret than accuracy or exact match.
3.5 Pass@k for Generation Tasks
When a model can produce multiple candidates, especially in code generation, a common question is whether at least one of the samples solves the task. This is captured by pass@k.
If you draw $k$ samples, pass@k estimates the probability that at least one sample is correct. This is useful because stochastic decoding can make a model appear stronger when given multiple attempts.
The standard unbiased estimator is:
$$
\mathrm{pass@}k = 1 – \frac{\binom{n-c}{k}}{\binom{n}{k}}
$$
where $n$ is the number of generated samples and $c$ is the number of correct samples.
This metric matters for coding assistants and synthetic data generation, but it should be interpreted carefully. A good pass@10 score does not guarantee a good single-shot user experience.
4. Benchmark Datasets and Standardized Tests
Benchmarks are useful because they provide shared tasks and comparability, but they are not the same thing as product evaluation.
Widely used benchmark families include:
- GLUE and SuperGLUE for language understanding tasks.
- SQuAD for reading comprehension.
- MMLU for broad academic and professional knowledge.
- BIG-bench and BIG-bench Hard for challenging reasoning and generalization tasks.
- GSM8K for grade-school math reasoning.
- HumanEval and MBPP for code generation.
- HELM for multi-dimensional evaluation across scenarios and metrics.
These benchmarks are valuable, but they come with three important warnings:
- Benchmark contamination is real. Models may have seen parts of the benchmark during training.
- Benchmark scores often reward narrow test-taking behavior rather than domain usefulness.
- Strong benchmark performance does not guarantee safety, reliability, or business value in production.
The better strategy is to combine public benchmarks with domain-specific evaluation sets built from your actual use case. That broader shift from model scoring to system scoring is even clearer in agentic system evaluation, where tool use, trajectories, and recovery behavior also need explicit measurement.
5. Human Evaluation and LLM-as-a-Judge
Eventually, many important LLM qualities must be judged by humans, especially when multiple answers are acceptable.
Common human evaluation dimensions include:
- Fluency
- Coherence
- Relevance
- Factual accuracy
- Helpfulness
- Harmlessness
- Instruction compliance
Human review works best when you define a rubric before scoring. For example, instead of asking annotators whether an answer is “good,” define a 1 to 5 scale for factual grounding, completeness, and clarity separately.
An increasingly common shortcut is to use an LLM as a judge. Frameworks such as G-Eval and production evaluation tools such as Inspect use rubric-based model judgments to scale review.
This is useful, but it introduces another model into the evaluation loop. That creates risks:
- The judge may prefer certain writing styles.
- The judge may be biased toward outputs from related model families.
- The judge may overrate confident but wrong responses.
The safe pattern is to calibrate LLM-as-a-judge scores against a smaller human-labeled set. In practice, this is similar to quantifying prompt quality: you need a rubric that is explicit enough to compare prompt or judge changes over time.
6. Safety, Fairness, and Robustness Metrics
A model that scores well on standard accuracy metrics can still fail badly in production. That is why evaluation should include targeted checks for failure modes.
Bias and fairness:
Bias evaluation, which connects to broader ethics and fairness in machine learning, looks for systematic differences in how the model responds across demographic groups, languages, dialects, or regions. The exact metric depends on the application, but common approaches include:
- Comparing refusal rates across user groups.
- Measuring sentiment or toxicity differences for matched prompts.
- Auditing downstream decision disparities.
Safety and toxicity:
Safety evaluation checks whether the model produces harmful, sexual, hateful, illegal, or self-harm-related content when it should refuse or redirect. This usually involves red-team prompts, refusal correctness, and policy-specific pass rates. Adding guardrails for LLMs is a complementary approach that enforces content policies at the system level, providing a safety net beyond model-level evaluation.
Robustness:
Robustness asks whether performance stays stable under perturbations such as:
- Typos or paraphrases
- Long context windows
- Contradictory instructions
- Prompt injection attempts
- Tool failures or missing context
A robust model should degrade gracefully rather than fail catastrophically.
7. Efficiency Metrics
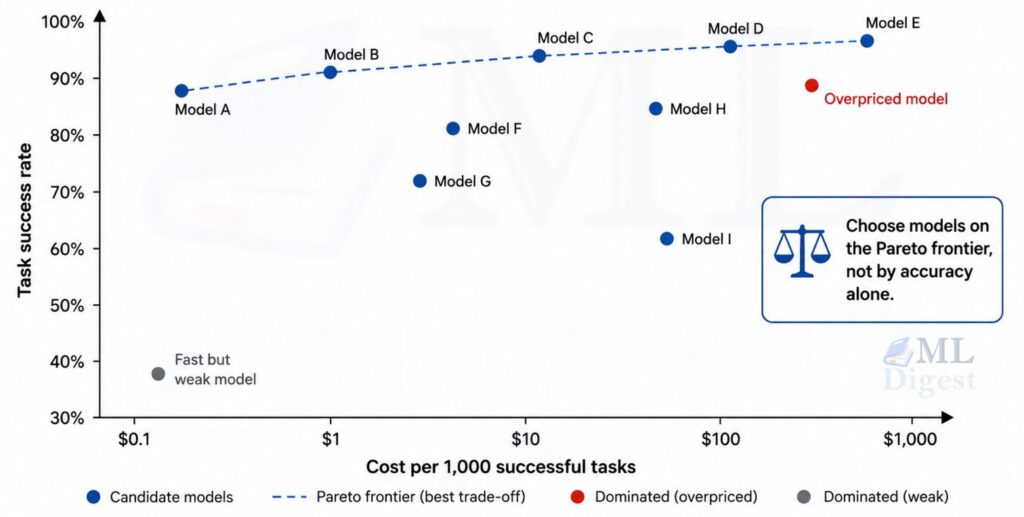
A highly accurate model may still be a poor deployment choice if it is too expensive or too slow.
Important operational metrics include:
7.1 Latency
Latency is the time taken to deliver a response. For interactive applications, it is often useful to measure:
- Time to first token (TTFT)
- Time to last token (TTLT)
- p50, p95, and p99 latency percentiles
Mean latency alone can hide bad tail behavior, so percentile reporting is usually more informative. Infrastructure choices such as KV caching have a direct impact on TTFT and overall throughput, making them important to account for when comparing latency across serving configurations.
7.2 Throughput
Throughput measures how many requests or tokens your system can process in a fixed time window. This matters for production scaling and cost planning.
7.3 Resource Utilization and Cost
Track GPU memory, CPU utilization, tokens per second, and cost per successful task. In real systems, cost per useful answer is often a better business metric than cost per raw request.
8. A Practical Evaluation Workflow
The cleanest way to evaluate an LLM is to treat it like a product system rather than a research demo.
8.1 Build a Layered Evaluation Set
Use at least four slices of data:
- A representative set from real user tasks.
- A hard set with previously observed failures.
- A safety set with adversarial prompts.
- A regression set you keep fixed across versions.
This lets you detect both average quality shifts and rare but dangerous regressions.
8.2 Combine Automated and Human Checks
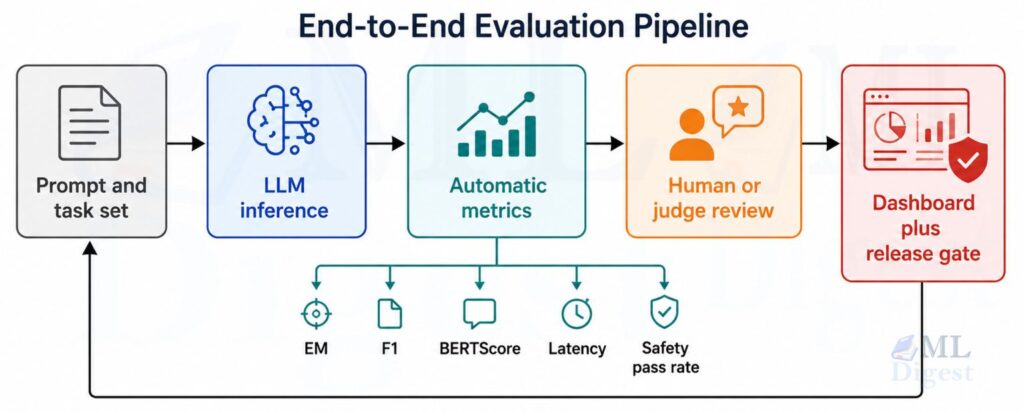
Automated metrics are great for scale, but they should not be your only gate. A practical stack often looks like this:
- Automated exact-match or task metrics for fast iteration.
- Semantic or rubric-based scoring for open-ended tasks.
- Human review on a smaller sample for calibration.
- Safety red teaming before release.
8.3 Report Slices, Not Just One Global Average
A model with 85 percent overall accuracy may still fail badly for long prompts, multilingual inputs, or sensitive tasks. Slice-based reporting is often more useful than a single headline number.
Useful slices include:
- Prompt length
- Domain or topic
- Language
- Difficulty level
- Safety category
- Tool availability
8.4 Measure Regression Over Time
Evaluation is not a one-time activity. Prompt changes, model upgrades, and infrastructure changes can all affect behavior. LLM performance can degrade in subtle ways after updates, making versioned tracking essential. Store evaluation results by version so you can compare runs and catch regressions early.
Useful tools for this include OpenAI Evals, lm-evaluation-harness, Inspect, and LangSmith. If you are evaluating a full production stack rather than a bare model, MLOps practices help keep these runs versioned, reproducible, and comparable across releases.
9. Common Mistakes When Measuring LLMs
Several evaluation mistakes show up repeatedly.
Using only one metric:
No single number can capture all relevant qualities of an LLM. A model can improve on ROUGE while getting less factual. Another can improve on reasoning benchmarks while becoming slower and more expensive.
Optimizing to the benchmark:
Leaderboard chasing can produce systems that look better on public datasets but do not help real users. Always reserve part of your effort for domain-specific testing.
Ignoring variance from sampling:
If temperature is nonzero, results can vary across runs. For stochastic tasks, use repeated sampling or fixed seeds where possible, and report confidence intervals if the decision is important.
Mixing evaluation settings:
If two models use different prompts, context, or tool access, then a raw comparison is not fair. Fix the protocol first, then compare.
Forgetting failure severity:
All mistakes are not equally costly. A weak marketing headline is inconvenient. A hallucinated medical instruction or incorrect financial recommendation is much more serious. Weight your evaluation by application risk.
Final Takeaway
Measuring LLM performance is not about finding one perfect score. It is about building a reliable measurement system that reflects the real job the model must do. Perplexity helps you understand predictive quality. Accuracy and F1 help on structured tasks. BLEU and ROUGE give rough overlap signals. Semantic metrics and human evaluation help with open-ended responses. Safety, fairness, robustness, latency, and cost tell you whether the model is actually fit for deployment.
The strongest evaluation strategy is therefore layered. Use multiple views, validate them against real tasks, and keep the whole process versioned and repeatable. That is how an LLM stops being an impressive demo and becomes a dependable system.

Silpa brings 5 years of experience in working on diverse ML projects, specializing in designing end-to-end ML systems tailored for real-time applications. Her background in statistics (Bachelor of Technology) provides a strong foundation for her work in the field. Silpa is also the driving force behind the development of the content you find on this site.

Happy is a seasoned ML professional with over 15 years of experience. His expertise spans various domains, including Computer Vision, Natural Language Processing (NLP), and Time Series analysis. He holds a PhD in Machine Learning from IIT Kharagpur and has furthered his research with postdoctoral experience at INRIA-Sophia Antipolis, France. Happy has a proven track record of delivering impactful ML solutions to clients. Check more about him here: https://sites.google.com/site/slhappyin/
Subscribe to our newsletter!