Imagine training models the way a research lab might run chemistry experiments. Every run changes something slightly: the learning rate, the data split, the preprocessing steps, the model family, or the evaluation threshold. After a week, you have dozens of results, a few saved models, some plots, and a vague memory that “run 17 looked promising.”
MLflow exists to prevent that kind of chaos. It gives your machine learning work a lab notebook, a filing cabinet, and a searchable dashboard. Instead of relying on ad hoc folders and memory, you log each run’s parameters, metrics, artifacts, and metadata in a consistent format. That makes experiments comparable, reproducible, and much easier to share with other people.
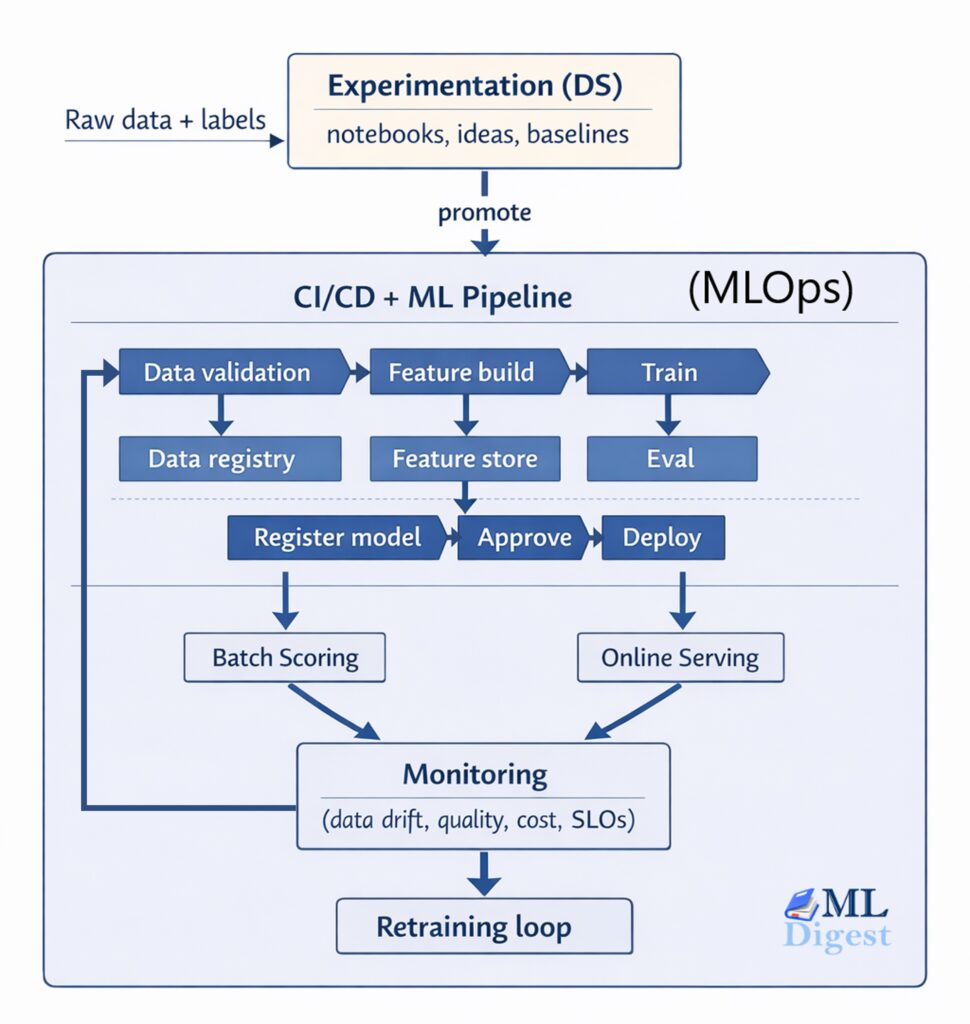
This guide explains what MLflow is, why it matters, how its core pieces fit together, and how to use it in realistic workflows. It also includes two operational scenarios that matter in practice: working on a remote machine and logging runs to a centralized MLflow server that the whole team can share. If you want the bigger frame around where experiment tracking fits, the machine learning project lifecycle is the broader system around it.
1. What MLflow Is Actually Solving
At a high level, MLflow helps answer a few practical questions:
- Which code, data setup, and hyperparameters produced this result?
- Which run generated the model file currently under consideration?
- How do we compare runs across experiments without hand-built spreadsheets?
- How can multiple team members log to the same place without stepping on each other?
The first time you use MLflow seriously, the value is usually not in any single API call. The value is that it turns model development into a traceable process.
1.1 The Core Objects
The official MLflow Tracking documentation organizes work around a few simple objects:
- Run: One execution of training or evaluation code.
- Experiment: A logical container that groups related runs.
- Metrics: Numeric outcomes such as accuracy, loss, F1 score, RMSE, latency, or calibration error.
- Parameters: Configuration values such as learning rate, batch size, optimizer choice, or model depth.
- Artifacts: Files produced by the run, such as plots, feature statistics, checkpoints, confusion matrices, or serialized models.
- Tags: Extra metadata for search and filtering, such as owner, dataset version, Git commit, or environment.
That data model is intentionally simple. The point is not to hide the training loop. The point is to create a common record around it.
1.2 A Useful Mental Model
Think of MLflow as a metadata layer around your machine learning code.
Your training script still does the real work. It loads data, fits a model, evaluates results, and writes files. MLflow sits beside that script and records what happened. This separation is why it works with many libraries, including scikit-learn, PyTorch, XGBoost, LightGBM, and more.
2. Why MLflow Matters in Real Projects
Small notebooks can survive without formal tracking for a while. Real projects usually cannot.
As soon as you have any of the following, MLflow becomes valuable:
- repeated experiments over several days or weeks
- multiple people training related models
- a need to compare baselines against newer ideas
- a need to keep model files, metrics, and code context connected
- a requirement to promote selected models toward staging or production
Without tracking, teams often end up with model files named things like final_model_v3_really_final.pkl. That is not a tooling problem alone, it is a process problem. MLflow helps enforce a better process with very little friction.
3. The Main Components in a Practical MLflow Setup
Before looking at commands, it helps to separate the pieces that MLflow combines.
In a typical setup, four parts matter most:
- Tracking API in your code: the
mlflowcalls inside training or evaluation scripts - Backend store: the metadata store for experiments, runs, parameters, metrics, and tags
- Artifact store: the file store for models, plots, reports, and other run outputs
- Tracking server: the HTTP service that exposes the UI and gives multiple clients a shared endpoint
For solo work, these pieces can all live on one machine with very little configuration. For team use, they are often separated so metadata goes to a database and artifacts go to shared object storage.
This distinction matters because people often say “MLflow” as if it were one thing. In practice, the client API, metadata store, artifact store, and server each solve a different part of the experiment management problem. That is also why MLflow is best understood as one layer inside a larger MLOps system rather than the entire operating model.
3.1 How MLflow Works Under the Hood
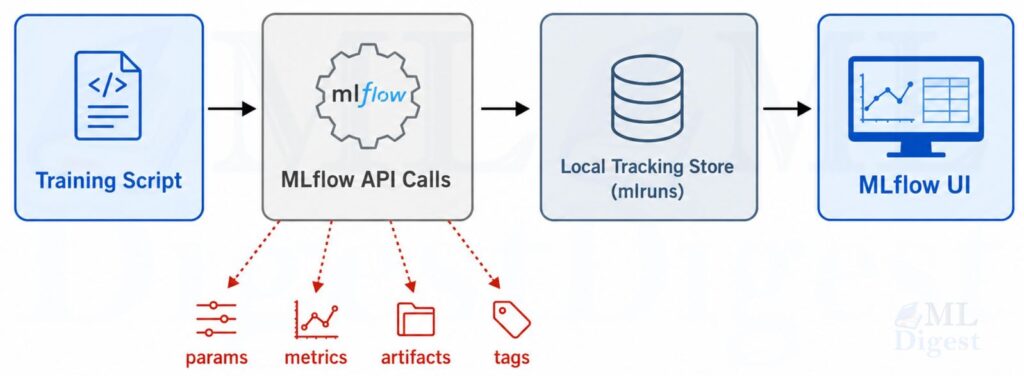
The basic local workflow is simple:
- Your Python code starts a run.
- During training, it logs parameters, metrics, tags, and artifacts.
- MLflow writes metadata and artifacts to its configured stores.
- You inspect the results in the UI or through the API.
By default, MLflow logs locally to an mlruns directory. That is the easiest place to start and is explicitly documented in the tracking guide.
3.2 Visualization: The Local MLflow Workflow
3.3 Tracking Store vs Artifact Store
One of the most important architectural distinctions in MLflow is the difference between metadata and artifacts.
- The backend store keeps structured metadata such as experiment names, run IDs, parameters, metrics, tags, and lifecycle state.
- The artifact store keeps files such as model checkpoints, plots, and exported reports.
The MLflow tracking server architecture docs and related self-hosting pages describe these as separate concerns because they scale differently. Small metadata fits well in a relational database. Large model files often belong in object storage such as Amazon S3, Google Cloud Storage, or Azure Blob Storage.
4. A Minimal but Real MLflow Example
The following example uses scikit-learn and logs a full training run: parameters, metrics, a model artifact, and a small report file. It is intentionally compact, but it reflects a realistic pattern.
Install the dependencies first:
pip install mlflow scikit-learn pandasThen run this script:
from pathlib import Path
import json

import mlflow
import mlflow.sklearn
import pandas as pd

from sklearn.datasets import load_wine
from sklearn.linear_model import LogisticRegression
from sklearn.metrics import accuracy_score, f1_score
from sklearn.model_selection import train_test_split
from sklearn.pipeline import Pipeline
from sklearn.preprocessing import StandardScaler


# Load a small built-in dataset so the example is runnable as-is.
X, y = load_wine(return_X_y=True, as_frame=True)

X_train, X_test, y_train, y_test = train_test_split(
    X,
    y,
    test_size=0.2,
    random_state=42,
    stratify=y,
)


experiment_name = "mlflow-wine-demo"
mlflow.set_experiment(experiment_name)

max_iter, C = 500, 1.0
pipeline = Pipeline(
    steps=[
        ("scaler", StandardScaler()),
        ("model", LogisticRegression(max_iter=max_iter, C=C)),
    ]
)

with mlflow.start_run(run_name="logreg_baseline"):
    pipeline.fit(X_train, y_train)
    predictions = pipeline.predict(X_test)

    accuracy = accuracy_score(y_test, predictions)
    macro_f1 = f1_score(y_test, predictions, average="macro")

    mlflow.log_param("model_type", "logistic_regression")
    mlflow.log_param("max_iter", max_iter)
    mlflow.log_param("C", C)
    mlflow.log_param("dataset", "sklearn_wine")

    mlflow.log_metric("accuracy", float(accuracy))
    mlflow.log_metric("macro_f1", float(macro_f1))

    metrics_report = {
        "accuracy": float(accuracy),
        "macro_f1": float(macro_f1),
        "n_train_rows": int(len(X_train)),
        "n_test_rows": int(len(X_test)),
    }

    output_dir = Path("artifacts")
    output_dir.mkdir(exist_ok=True)
    report_path = output_dir / "metrics_summary.json"
    feature_path = output_dir / "feature_sample.csv"

    report_path.write_text(json.dumps(metrics_report, indent=2), encoding="utf-8")
    X_test.head(10).assign(target=y_test.head(10).values).to_csv(feature_path, index=False)

    mlflow.log_artifact(str(report_path))
    mlflow.log_artifact(str(feature_path))
    mlflow.sklearn.log_model(pipeline, artifact_path="model")

    mlflow.set_tag("owner", "ml-team")
    mlflow.set_tag("purpose", "baseline classification experiment")

print(f"accuracy={accuracy:.4f}, macro_f1={macro_f1:.4f}")4.1 What This Example Demonstrates
This script shows the most important MLflow habit: log the context together with the result.
Notice what gets captured in one place:
- configuration values such as
max_iterandC - evaluation metrics such as accuracy and macro F1
- generated files such as a JSON report and CSV sample
- the trained model itself
- tags that make later filtering easier
That is the difference between “I trained a model” and “I can explain exactly what produced this model.”
4.2 Optional Shortcut: Autologging
MLflow also supports autologging, which can capture many parameters and metrics automatically for supported libraries.
The convenience is real, but it is usually best to understand manual logging first. Once you understand what should be recorded, mlflow.autolog() becomes a useful accelerator rather than a black box.
5. How to View and Compare Runs
If you log to the local mlruns directory, you can launch a local tracking server and open the UI with:
mlflow server --host 127.0.0.1 --port 8080Then open http://127.0.0.1:8080.
Inside the UI, you can usually do four things that matter immediately:
- inspect experiments and runs
- sort runs by metrics
- compare parameter choices side by side
- download artifacts or inspect logged models
Programmatic search is also available through MlflowClient, which becomes useful when you want to automate run selection or reporting. MLflow 3 introduced mlflow.search_logged_models(), which makes it easier to search logged models directly instead of only searching runs.
6. Organizing Experiments So They Stay Useful
MLflow is easy to start using, but it can still become messy if run names and experiments are poorly structured.
Good defaults include:
- one experiment per project, task, or major dataset condition
- descriptive run names such as
xgboost_depth8_seed42 - tags for
git_commit,owner,dataset_version, andenvironment - consistent metric names such as
val_accuracy,test_f1, orrmse
If you are running sweeps, nested runs are often helpful. Parent runs can represent the overall search job, while child runs represent each trial.
7. Using MLflow on a Remote Machine
This is one of the most common real-world workflows. You develop from a laptop, but the actual training happens on a remote GPU server, a cloud VM, or a managed compute node.
There are two main patterns.
7.1 Pattern A: Log Locally on the Remote Machine
In the simplest case, your training job runs on the remote machine and writes to that machine’s local mlruns directory.
That looks like this:
- SSH into the remote machine.
- Run your training script there.
- Start the MLflow UI on the remote machine.
- Use SSH port forwarding to view the UI from your laptop.
Example commands:
# On the remote machine
mlflow server --host 127.0.0.1 --port 8080
# On your local machine
ssh -L 8080:127.0.0.1:8080 your-user@your-remote-hostNow opening http://127.0.0.1:8080 on your laptop forwards traffic to the remote MLflow UI.
This approach is simple and useful when:
- you are the only person using that machine
- you do not yet need shared tracking
- you want to keep setup overhead low
The limitation is that the data is tied to that machine unless you copy or migrate it later.
The stronger setup is to let the remote training machine send logs to a separate tracking server.
In that case, the training code only needs the tracking URI:
import mlflow

mlflow.set_tracking_uri("http://mlflow.company.internal:8080")
mlflow.set_experiment("remote-gpu-experiments")

with mlflow.start_run(run_name="resnet50_remote_run"):
    mlflow.log_param("device", "remote_gpu_box")
mlflow.log_metric("val_accuracy", 0.913)You can also set the URI via the MLFLOW_TRACKING_URI environment variable, which the tracking server documentation explicitly supports:
export MLFLOW_TRACKING_URI=http://mlflow.company.internal:8080
python train.py
This pattern is better when training is ephemeral, when machines come and go, or when you want a permanent record independent of any one compute instance. It also makes it easier to keep artifact storage and access controls separate from the lifecycle of the training machine.
7.3 Practical Tips for Remote Workflows
- Log the hostname, GPU type, and environment as tags so remote runs are easy to audit.
- Log the Git commit hash for every meaningful run.
- Prefer a centralized artifact store if remote machines are disposable.
- Be explicit about data paths, because relative paths on a remote box are often the first source of confusion.
- If you are moving large artifacts through the tracking server proxy, watch for timeout configuration on the server side.
8. Using MLflow with a Centralized Tracking Server for the Whole Team
Once several people are training models, the right question changes from “How do I log my run?” to “How do we log our runs to the same governed system?”
This is where a centralized MLflow Tracking Server becomes important.
8.1 The Team Architecture
The standard team-oriented setup has three layers:
- Clients: laptops, notebooks, remote jobs, CI pipelines, training services
- Backend store: a database such as PostgreSQL for experiment and run metadata
- Artifact store: shared object storage such as S3, Azure Blob Storage, or GCS for models and files
The MLflow tracking server sits in front of those stores and gives the team one stable endpoint.
For a team deployment, a typical command looks like this:
mlflow server \
  --host 0.0.0.0 \
  --port 8080 \
  --allowed-hosts "mlflow.company.com" \
  --backend-store-uri postgresql://mlflow_user:password@db-host:5432/mlflow \
  --artifacts-destination s3://team-mlflow-artifacts
This reflects the pattern documented in the official self-hosting guides:
- metadata goes to a database
- artifacts go to shared storage
- clients log through one server endpoint
When the server listens on 0.0.0.0, the current docs recommend configuring --allowed-hosts to reduce DNS rebinding risk. In production, you should usually place the tracking server behind a reverse proxy with TLS and authentication.
8.3 Security and Access Basics
For shared deployments, the tracking server should be treated like any other internal application endpoint.
The practical baseline is:
- terminate HTTPS at a reverse proxy or gateway
- require authentication before users reach the server
- decide whether artifact access is proxied through MLflow or direct to storage
- keep storage credentials on the server side when you want tighter central control
On the client side, MLflow supports environment variables such as MLFLOW_TRACKING_USERNAME and MLFLOW_TRACKING_PASSWORD for basic authentication, or MLFLOW_TRACKING_TOKEN for bearer-token style access. That makes it easier to point notebooks, scripts, CI jobs, and remote training workers at the same endpoint without hard-coding credentials in code.
8.4 Logging from Any Team Member’s Machine
Every team member points their training code to the same server:
import mlflow
import mlflow.sklearn

mlflow.set_tracking_uri("https://mlflow.company.com")
mlflow.set_experiment("fraud-detection")

with mlflow.start_run(run_name="alice_xgb_baseline"):
    mlflow.log_param("author", "alice")
    mlflow.log_param("model_family", "xgboost")
mlflow.log_metric("val_auc", 0.941)Or through environment variables:
export MLFLOW_TRACKING_URI=https://mlflow.company.com
export MLFLOW_TRACKING_USERNAME=alice
export MLFLOW_TRACKING_PASSWORD=your-password
python train.py
The tracking server security documentation documents environment variables for basic authentication, bearer-token based access, and TLS certificate handling.
8.5 Why Centralization Helps Teams
A centralized server makes several important workflows easier:
- everyone compares runs in one UI instead of across personal machines
- artifact retention is independent of any single developer laptop or VM
- permissions and audit controls can be managed centrally
- model promotion and registry workflows become more consistent
- automated jobs can log into the same history as manual experiments
This is the moment when MLflow becomes more than a convenience tool. It becomes part of the team’s operating system for model development.
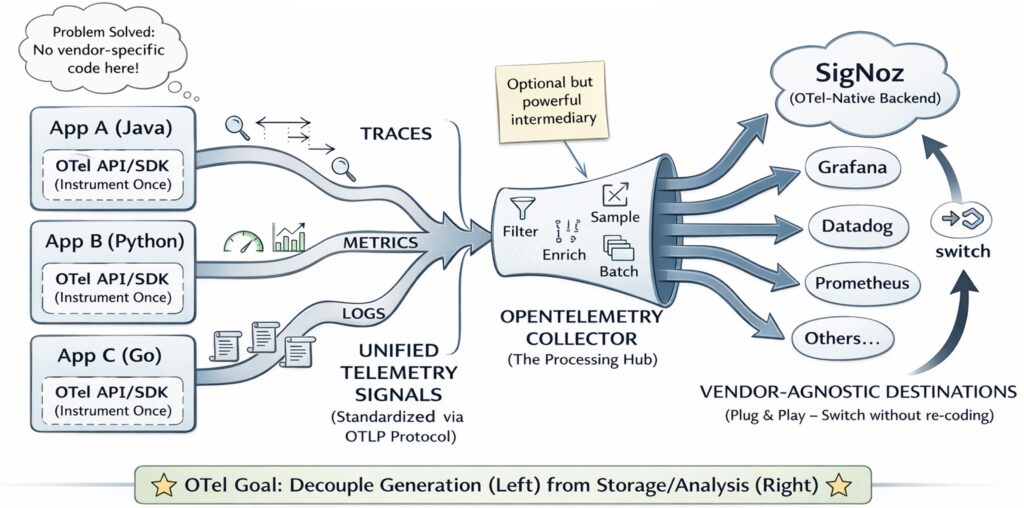
At that point, experiment tracking is only part of the observability story. OpenTelemetry becomes a strong complement when you need to trace requests across training jobs, storage layers, gateways, and other services around the MLflow server itself.
8.6 A Few Operational Caveats
- Use a real database such as PostgreSQL for multi-user production setups. SQLite is fine for local or light use, but PostgreSQL or MySQL is a better default once concurrency matters.
- Decide whether the server should proxy artifact access or whether clients should upload directly to storage. The official docs distinguish these clearly with
--artifacts-destinationversus--default-artifact-rootplus--no-serve-artifacts. - If you change artifact-serving mode later, create new experiments rather than assuming old experiments will transparently switch behavior. MLflow records artifact location behavior at experiment creation time.
- Keep client and server versions reasonably aligned, and verify the server version if behavior looks inconsistent.
- If large artifact uploads time out through the proxy, review the server timeout settings instead of assuming the storage layer is the problem.
9. Model Registry and Lifecycle Management
Tracking experiments is the first layer. The next layer is deciding which model artifact is approved for downstream use.
That is where the MLflow Model Registry fits. In a mature workflow, tracking tells you what happened during experimentation, while the registry helps define what is accepted for deployment or further validation.
In open-source MLflow, the registry gives you a named model, version history, tags, descriptions, and aliases. Aliases are especially useful because deployment code can refer to a stable name such as models:/fraud-model@champion instead of hard-coding a version number.
An effective pattern is:
- train and log several candidate runs
- compare metrics, artifacts, and notes
- select a candidate model
- register or promote that model under team rules and stable aliases
This is much cleaner than treating every saved model file as equally important.
10. Best Practices That Make MLflow More Valuable
MLflow works best when it is paired with disciplined habits.
The following practices have high leverage:
- Log code version, data version, seed, and environment, not just final metrics.
- Use consistent experiment names and metric keys.
- Log intermediate artifacts that explain behavior, not just the final model.
- Add human-readable notes or tags for important runs.
- Record enough system context to reproduce the run, such as Python version, package environment, and hardware when relevant.
- Keep one experiment for a coherent question, not a random pile of unrelated runs.
- Use nested runs for hyperparameter searches, ablations, or cross-validation slices.
- Prefer centralized tracking for anything that matters beyond a single developer.
Common Mistakes
The most common mistakes are not about syntax. They are about weak experiment hygiene.
Watch for these failure modes:
- logging metrics but not the parameters that produced them
- saving a model artifact without evaluation context
- using vague run names like
test1ornew_run - mixing local-only artifacts with runs that the team expects to be shared
- treating autologging as a replacement for deliberate metadata design
Final Perspective
MLflow is useful because it improves memory, comparison, and coordination. That sounds modest, but those are exactly the places where machine learning projects quietly lose time and trust.
If you are working alone, MLflow gives structure to your experiments. If you are working on a remote machine, it gives you a way to keep results visible and organized. If you are working as a team, a centralized MLflow server becomes the shared record of how models were built, evaluated, and selected.
That is why MLflow remains a strong default in open MLOps workflows. It does not try to replace your training code. It makes that code explain itself.

Silpa brings 5 years of experience in working on diverse ML projects, specializing in designing end-to-end ML systems tailored for real-time applications. Her background in statistics (Bachelor of Technology) provides a strong foundation for her work in the field. Silpa is also the driving force behind the development of the content you find on this site.

Happy is a seasoned ML professional with over 15 years of experience. His expertise spans various domains, including Computer Vision, Natural Language Processing (NLP), and Time Series analysis. He holds a PhD in Machine Learning from IIT Kharagpur and has furthered his research with postdoctoral experience at INRIA-Sophia Antipolis, France. Happy has a proven track record of delivering impactful ML solutions to clients.
Subscribe to our newsletter!