Anomaly detection, also known as outlier detection, aims at identifying instances that deviate significantly from the norm within a dataset. The significance of anomaly detection is manifold, especially in real-time applications such as Fraud Detection in finance, intrusion detection in cybersecurity, fault detection in manufacturing, and monitoring of medical conditions.
The objective of anomaly detection is to flag irregular observations – that are inconsistent with the expected behavior of a given system – for further investigation, which can lead to timely interventions and decision-making processes.
Understanding Anomalies
Anomalies can be broadly categorized into three types:
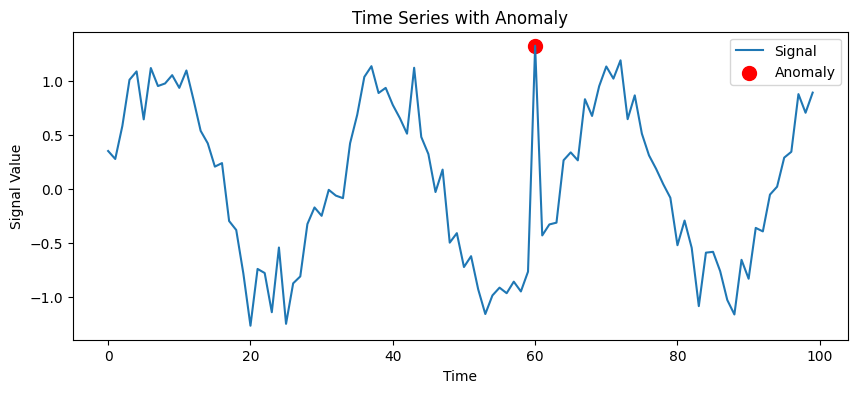
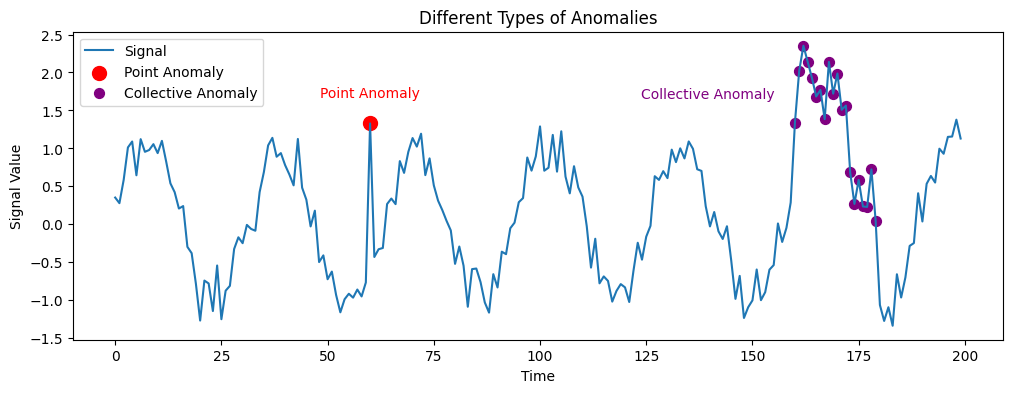
- Point Anomalies: These refer to individual data points that are considered unusual relative to the rest of the dataset. For instance, in a dataset of financial transactions, a transaction significantly larger than typical amounts could be categorized as a point anomaly.
- Contextual Anomalies: These anomalies emerge within a specific context. For example, a temperature reading of 30°C may be normal in southern climates during summer but would be anomalous in northern winter conditions.
- Collective Anomalies: This type refers to a set of data points that collectively exhibit a deviation from expected behavior, even if individual points might not be detected as anomalies. An example can be found in detecting fraud rings in credit card transactions where a series of transactions together may be suspicious but not individually.
Anomaly Detection Methods
Statistical Methods
Statistical methods are often grounded in classical statistics, utilizing assumptions about the distribution of data.
- Z-Score Analysis:
- The Z-score method establishes a threshold based on the standard deviation from the mean. A Z-score measures how many standard deviations an element is from the mean. A common practice is to flag data points with Z-scores greater than a threshold (e.g., 3 or -3).
- Grubbs’ Test:
- Designed to detect a single outlier in a univariate dataset that follows a normal distribution, Grubbs’ test is useful for identifying whether the maximum or minimum value is an outlier.
- Box Plot Method:
- This approach uses the interquartile range (IQR) to detect outliers. Data points that lie below Q1 – 1.5 * IQR or above Q3 + 1.5 * IQR are considered outliers.
- Kernel Density Estimation:
- This non-parametric method estimates probability density functions of random variables, allowing the identification of likelihood-based anomalies.
Classical Machine Learning Methods
Machine learning methods can be classified into supervised, semi-supervised, and unsupervised learning frameworks.
- Supervised Learning: In supervised anomaly detection, a model is trained using labeled datasets, i.e., datasets where instances of both normal and anomalous events are available. Common techniques include:
- Support Vector Machines (SVM): An SVM can be adapted for anomaly detection by training it to maximize the margin from the hyperplane. The instances that fall closest to the hyperplane can be considered anomalies.
- Decision Trees and Forests: Ensembles like Random Forests can be utilized for binary classification of normal versus anomalous instances.
- Semi-Supervised Learning: Semi-supervised techniques leverage a small proportion of labeled data, focusing primarily on the normal instances to model the behavior of expected data. Common techniques include:
- One-Class SVM: This variant of SVM trains on data that is solely from one class (normal) and classifies points that fall outside the learned boundary as anomalies.
- Unsupervised Learning: Unsupervised approaches do not require labeled data and often rely on clustering or density estimation:
- K-Means Clustering: Anomaly detection can be performed by considering points that lie farthest from the centroids of clusters.
- DBSCAN: A density-based clustering method that groups points based on proximity. Points that lie far from dense clusters can be flagged as anomalies.
- Isolation Forests: Isolation Forests are specifically designed for anomaly detection by creating binary trees that isolate points based solely on their feature values. Data points that are isolated quickly by the trees are considered anomalies.
Deep Learning Methods
Deep learning techniques fit into the category of high-dimensional data and complex patterns:
- Autoencoders: These neural network architectures are trained to reconstruct input data. Anomalies are detected when reconstruction errors exceed a defined threshold, as the network learns a compressed representation of normal patterns.
- Variational Autoencoders (VAEs): VAEs introduce a probabilistic twist to traditional autoencoders, generating data by sampling from latent space distributions. Anomalies can be detected by analyzing the reconstruction probabilities.
- Recurrent Neural Networks (RNNs): For time-series data, RNN architectures can be particularly effective, as they capture the temporal dependencies inherent in the data. Anomalies may be detected by forecasting future states and comparing them with actual observations.
- Convolutional Neural Networks (CNNs): CNNs can analyze spatial hierarchies in image data for anomaly detection. For instance, they can identify anomalies in medical imaging or manufacturing quality checks.
Information-Theoretic Approaches
Information-theoretic methods utilize concepts from statistical information theory to identify anomalies based on the loss of information.
- Entropy-based Methods: Anomaly detection can be performed by measuring the entropy of a given dataset. Points contributing to a significant increase in entropy could be regarded as anomalous.
- Kullback-Leibler Divergence: This measure of how one probability distribution diverges from a second, expected probability distribution can be leveraged for anomaly detection tasks, particularly in detecting shifts in data distributions over time.
Evaluation Metrics
Evaluating the effectiveness of anomaly detection algorithms is crucial to determining their utility in real-world scenarios. Standard metrics include:
- True Positive Rate (Sensitivity): The proportion of actual outliers correctly identified by the model.
- False Positive Rate: The proportion of normal observations incorrectly flagged as anomalies.
- Precision and Recall: Precision indicates the rate of true anomalies among all flagged anomalies, whereas recall indicates the ability of the model to identify all actual anomalies.
- F1 Score: A harmonic mean of precision and recall, particularly useful when dealing with class imbalances.
- Area Under the Curve (AUC): The receiver operating characteristic (ROC) curve plots true positive rates against false positive rates for different threshold settings. The AUC score provides an aggregated measure of a model’s performance across all classification thresholds.
- Confusion Matrix: This visualizes the performance of an algorithm by presenting true positive, true negative, false positive, and false negative rates in a matrix format.
Challenges in Anomaly Detection
- High Dimensionality: Anomaly detection in high-dimensional spaces can be challenging due to the curse of dimensionality, where data points become sparse.
- Imbalanced Datasets: Anomalies are often rare compared to normal instances, leading to imbalanced datasets that can skew model performance.
- Noise and Data Quality: Noisy data or missing values can significantly impact the performance of anomaly detection systems.
- Dynamic Environments: Anomaly detection models must adapt to changing data distributions and evolving definitions of anomalies.
- Interpretability: Many advanced anomaly detection algorithms, especially deep learning models, operate as black boxes, making it difficult to interpret their decisions.
Anomaly detection has wide-ranging applications across various domains:
- Finance:
- Fraud detection in transactions.
- Monitoring for abnormal trading activities in stock markets.
- Healthcare:
- Patient monitoring devices to detect anomalies in physiological signals (e.g., heart rate, ECG signals).
- Predicting rare diseases or adverse drug reactions.
- Cybersecurity:
- Intrusion detection systems that flag unusual traffic or access patterns within networks.
- Identifying malware based on deviations from normal application behavior.
- Manufacturing:
- Monitoring machinery for early signs of failure by detecting anomalies in sensor data.
- Quality assurance processes that identify defect patterns.
- Telecommunications:
- Network anomaly detection, identifying atypical utilization or performance issues.
- IoT and Smart Cities:
- Anomalies in sensor readings can indicate malfunctions or security breaches in smart devices.
Closing Thoughts
Anomaly detection is a multifaceted domain that combines statistical and ML methodologies to identify outliers and deviations from normal behavior across diverse applications. Through the continued study and refinement of these techniques, we can anticipate even more sophisticated algorithms capable of tackling complex data landscapes, maintaining the necessary balance between accuracy and interpretability, and significantly enhancing decision-making processes across sectors.

Happy is a seasoned ML professional with over 15 years of experience. His expertise spans various domains, including Computer Vision, Natural Language Processing (NLP), and Time Series analysis. He holds a PhD in Machine Learning from IIT Kharagpur and has furthered his research with postdoctoral experience at INRIA-Sophia Antipolis, France. Happy has a proven track record of delivering impactful ML solutions to clients.
Subscribe to our newsletter!